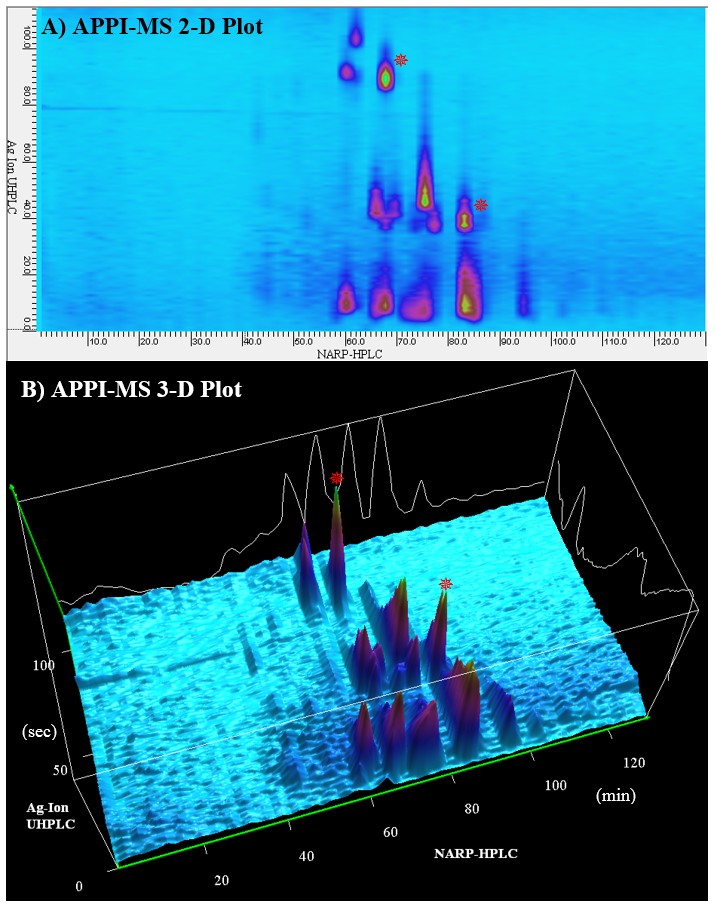
Figure 10-17. APPI-MS detection of cherry pit oil (CPO) triacylglycerols (TAGs) as part of comprehensive LC1MS2 x LC1MS2 experiment. Visualized using LC x LC software by GC Image, Inc. (A) Two dimensional contour plot of CPO TAGs and (B) three-dimensional plot from the same MS detector. Peaks marked by correspond to the same peaks in Fig. 10.16. APPI-MS, atmospheric pressure photoionization mass spectrometry; NARP-HPLC, nonaqueous reversed-phase high-performance liquid chromatography; UHPLC, ultra-high performance liquid chromatography. Thanks to Dharma Kodali and Lucas Stolp for CPO sample.
*Click on image for full-size .jpg*
<< Back to Chapter 10 <<