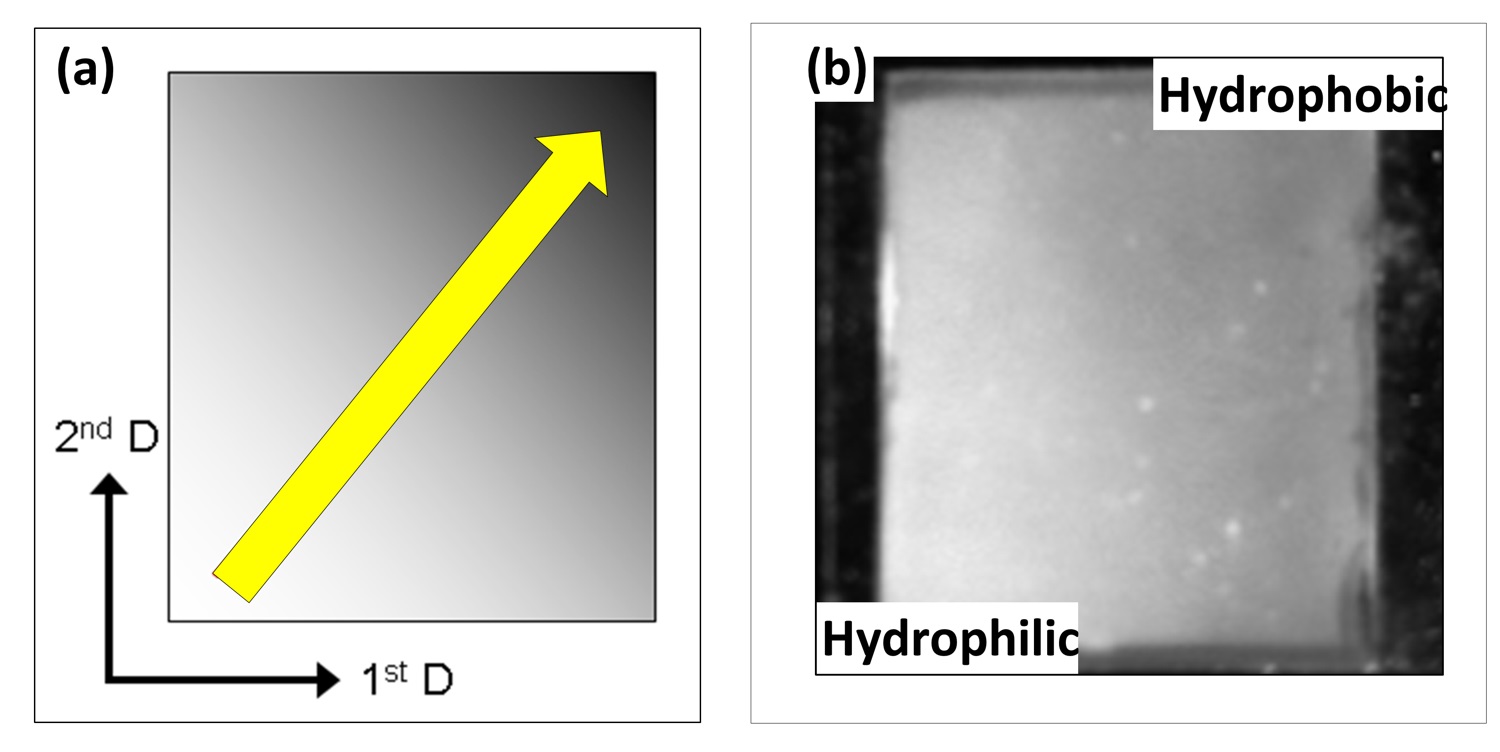
Figure 5-20. Artistic rendition of the gradient of hydrophobicity at a monolithic thin-layer chromatography plate increasing in the direction of the arrow together with suggested directions of the separations in first (1st D) and second dimension (2nd D) (A), and visualization of the gradient of hydrophobicity using fluorescent labeling with 1- anilinonaphthalene-8-sulfonic acid (B). The bright area at the left down corner represents the most hydrophilic part and the dark at top right most hydrophobic part.
*Click on image for full-size .jpg*
<< Back to Chapter 5 <<