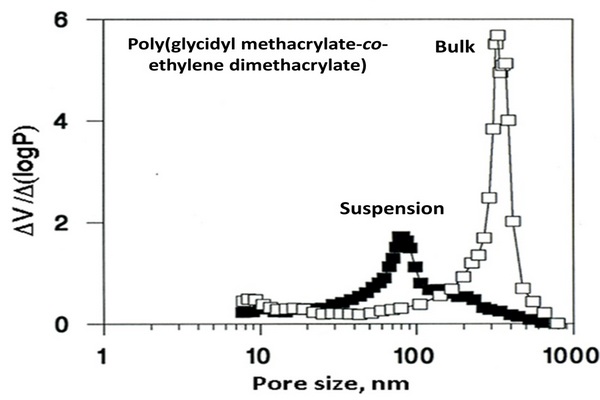
Chapter 5 - Introduction - Page 141

     Ever since the beginning of the 20th century, when Tswett first described the separation of chlorophylls in a liquid phase using a device filled with porous inorganic particles, and named the method chromatography (Tswett, 1906), chromatographers have been using columns packed with stationary phases in the shape of particles. Obviously, the column technology has been perfected during the following more than 110 years, and columns packed with particles are the “workhorse” of current liquid chromatography. The concept is simple: The mobile phase is pumped through the packed column and flows through the interstitial spaces that are, by default, always present between the particles.
     The vast majority of chromatographic packings are porous, with most of the interactive sites being presented on the pore surface, not at the external surface of the particles. The interactive sites are instrumental for attaining the separation, and the separated compounds have to reach them to achieve the separation. The pores inside the particle are filled with the mobile phase, which does not move and is stagnant. After injection of the sample in the stream of the mobile phase that is pushed through the voids between the packed particles, the difference between concentration of the separated compounds in the mobile phase and in the stagnant liquid in the pores is the driving force for transport of thes compounds in the pores. Once the compound interacts with the interactive sites, its concentration in the stagnant liquid decreases and the concentration gradient drives more compounds to enter the pores.
     The mechanism of this transport is diffusion, which is described by Fick’s second law:
(5.1)
where 4 is the concentration of the substance, t is the time, x is the position, and D is the diffusion
coefficient defined by the StokeseEinstein equation:
(5.2)
where kB is the Boltzmann constant, T is the temperature, h is the viscosity, and r is the radius of the diffusing entity. Eq. (5.1) indicates that the rate of diffusion depends on the diffusion coefficient D, which, according to Eq. (5.2), is specific for each compound and can only be enhanced by an increase in temperature or a decrease in viscosity of the mobile phase. These two effects are often interrelated because the viscosity of many liquids decreases with an increase in temperature. The size of the separated compound is given. The larger the molecule, the smaller the diffusion constant and the lower the overall diffusion rate. Hence, the diffusion of large molecules, such as proteins, nucleic acids, viruses, and synthetic polymers, is significantly slower than that observed for much smaller molecules including gases, ions, and small organic compounds.

Click on the thumbnail graphics below to access the original full-size figure.

Handbook of Advanced Chromatography / Mass Spectrometry Techniques - Chapter 5 Figure 1

Figure 5.1

Differential pore size distribution plots of the poly(glycidyl methacrylate-co-ethylene dimethacrylate) beads and monolith prepared from the same polymerization mixture consisting of glycidyl methacrylate (24%), ethylene dimethacrylate (15%), cyclohexanol (48%), dodecanol (12%), and azo-bis-isobutyronitrile (1% with respect to monomers) at a temperature of 70oC.
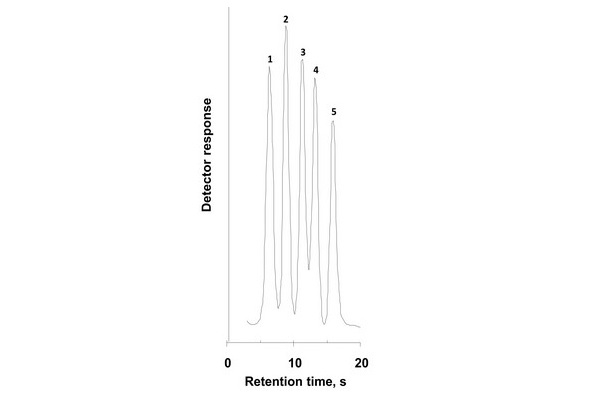
Handbook of Advanced Chromatography / Mass Spectrometry Techniques - Chapter 5 Figure 2

Figure 5.2

Fast reversed-phase separation of proteins. Conditions: Poly(styrene-co-divinylbenzene) monolithic column 50 x 4.6 mm I.D., mobile phase gradient 42%-90% acetonitrile in 0.15% aqueous trifluoroacetic acid in 0.35 min, flow rate 10 mL/min, UV detection at 280 nm. Peaks: ribonuclease (1), cytochrome c (2), bovine serum albumin (3), carbonic anhydrase (4), and ovalbumin (5).
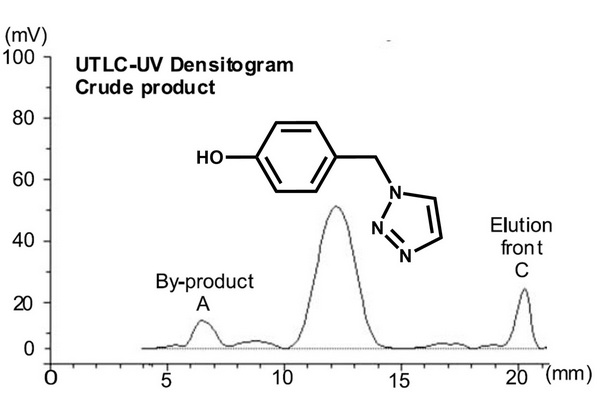
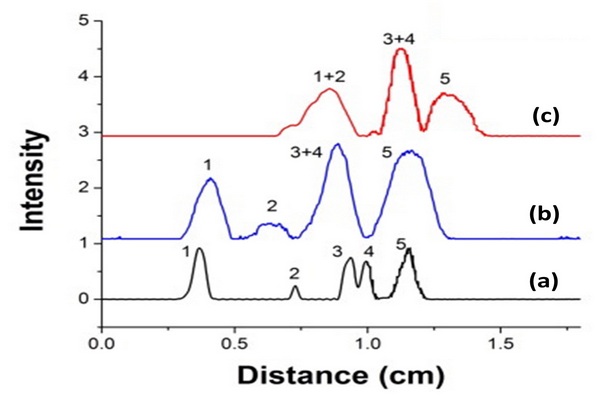
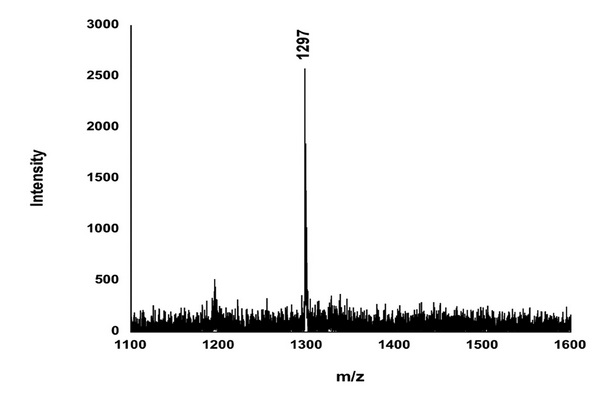
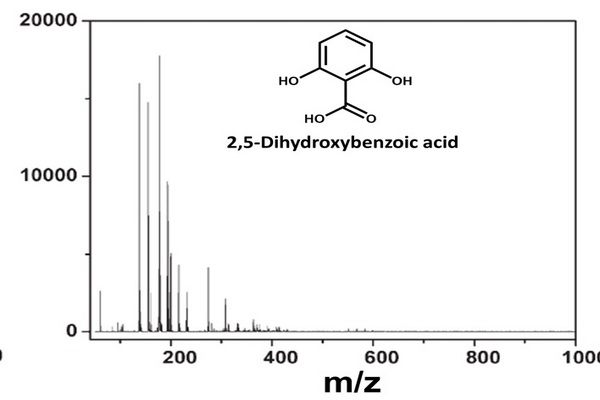
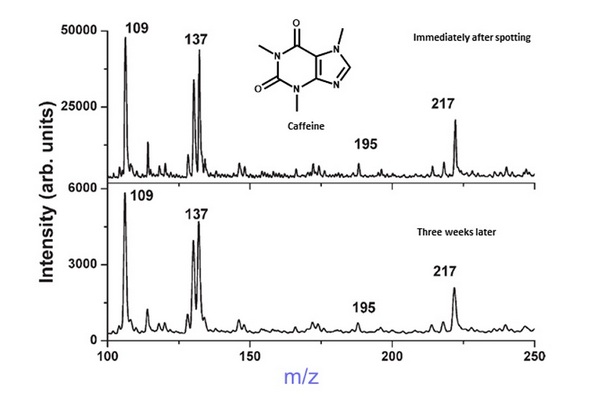
Handbook of Advanced Chromatography / Mass Spectrometry Techniques - Chapter 5 Figure 3

Figure 5.3

The separation of crude products from synthesis of triazole (m/z 176) using the mobile phase ethyl acetate n-hexane (1:2 v/v) with 2% acetic acid and presented as ultrathin layer chromatography (UTLC)-UV densitogram of the synthesis sample (top). Identification of peaks was achieved using atmospheric pressure matrix-assisted laser desorption/ionization (MALDI)-mass spectrometry (MS) spectra of the by-product A (m/z 369) (center) and the product (m/z 198 [M+Na]+ and m/z 107) (bottom). The main matrix ions are marked with asterisks.
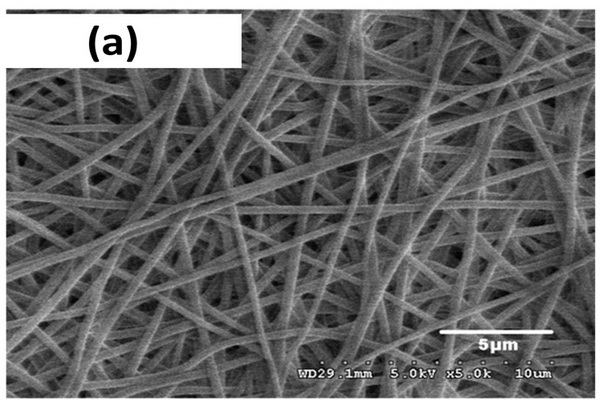
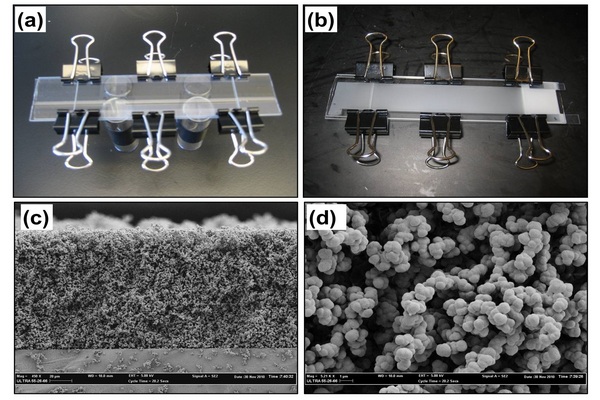
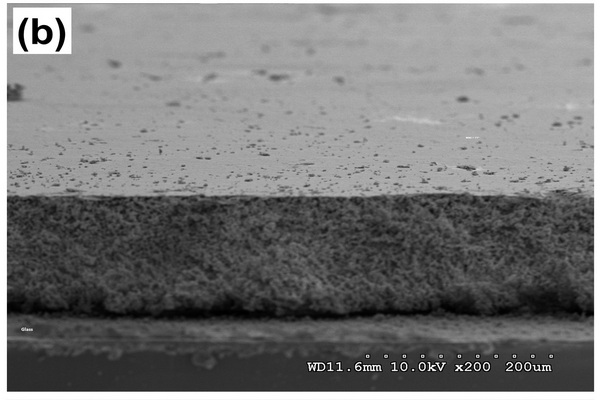
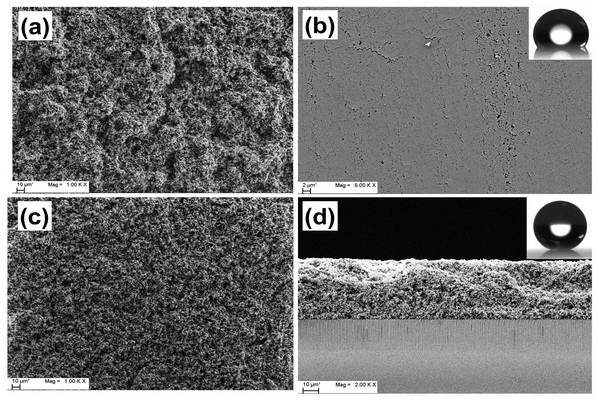
Handbook of Advanced Chromatography / Mass Spectrometry Techniques - Chapter 5 Figure 4

Figure 5.4

Scanning electron microcope images illustrating polyacrylonitrile layer prepared “conventional” electrospinning (A) and aligned electrospun polyacrylonitrile nanofibers generated on the rotating collector at rotational speeds of 1250 rpm (B).

Handbook of Advanced Chromatography / Mass Spectrometry Techniques - Chapter 5 Figure 5

Figure 5.5

Comparison of chromatograms showing the separation of (1) benzo[a]pyrene, (2) chrysene, (3) pyrene, (4) fluoranthene, and (5) phenanthrene using 0.5% multiwall carbon nanotubes-polyacrylonitrile plates, (A) 0.5% edge-plane carbon-polyacrylonitrile plates (B) using mobile phase 60:40 acetonitrile-water, and pure polyacrylonitrile plates (C) using mobile phase 70:30 acetonitrile-water mobile phase.

Handbook of Advanced Chromatography / Mass Spectrometry Techniques - Chapter 5 Figure 6

Figure 5.6

Matrix enhanced surface-assisted laser desorption/ ionization time-of-flight mass spectrum of angiotensin I using the poly(vinyl alcohol) substrate. An amount of 800 amol of angiotensin I was applied, and the CHCA matrix concentration was 0.1 mg/mL. The spectrum is the sum of 100 laser shots.

Handbook of Advanced Chromatography / Mass Spectrometry Techniques -  Chapter 5 Figure 7

Figure 5.7

Mask used to prepare monoliths with a circular shape via photopolymerization of butyl methacrylate and ethylene dimethacrylate on the top face of a matrix-assisted laser desorption/ionization (MALDI) plate (A), top view of the MALDI plate with monoliths (B), optical micrograph of two adjacent monolithic spots (C), and scanning electron microscope micrograph of macroporous structure of monolith C (D).

Handbook of Advanced Chromatography / Mass Spectrometry Techniques -  Chapter 5 Figure 8

Figure 5.8

Mold consisting of two glass plates separated by Teflon strips located along the long side used for the preparation of monolithic layer (A), the mold containing the white monolithic layer (B), scanning electron microscope image of the cross section of the monolith (C), and detailed view of the morphology of the monolithic layer (D).

Handbook of Advanced Chromatography / Mass Spectrometry Techniques -  Chapter 5 Figure 9

Figure 5.9

Scanning electron micrographs of poly(butyl methacrylate- co-ethylene dimethacrylate) monolithic layer prepared between two native glass plates (A) and a layer prepared using one plate (B), and both plates (C) functionalized with 3-(trimethoxysilyl)propyl methacrylate.

Handbook of Advanced Chromatography / Mass Spectrometry Techniques - Chapter 5 Figure 10

Figure 5.10

Scanning electron micrographs of monolithic poly(4 methylstyrene-co-chloro-methylstyrene- co divinylbenzene) layers. (A) Layer with rough surface prepared using two vinylized glass plates; (B) layer with smooth surface prepared using one vinylized glass plate; (C) monolithic thin layer with surface opened using Scotch tape; and (D) cross section of the 50-mm-thick layer attached to glass plate support.

Handbook of Advanced Chromatography / Mass Spectrometry Techniques - Chapter 5 Figure 11

Figure 5.11

Laser desorption/ionization mass spectra of blank spot of porous butyl methacrylate-based monolith and of 2,5- dihydroxybenzoic acid matrix.

Handbook of Advanced Chromatography / Mass Spectrometry Techniques - Chapter 5 Figure 12

Figure 5.12

Mass spectrum of caffeine desorbed/ionized from surface of porous butyl methacrylate-based monolith obtained immediately after preparation of the spot and spectrum of the same spot recorded 3 weeks after the previous one.

Handbook of Advanced Chromatography / Mass Spectrometry Techniques - Chapter 5 Figure 13

Figure 5.13

Thin-layer chromatography separation of mixture of peptides labeled with fluorescamine using poly(butyl acrylate- co-ethylene dimethacrylate) monolithic layer attached to a glass plate using 0.1 vol% trifluoroacetic acid in 45 vol% aqueous acetonitrile as the mobile phase (left) and matrix-assisted laser desorption/ionization time offlight mass spectrometry spectra of fluorescently labeled [Sar1,Ile8]-angiotensin II, angiotensin II, and neurotensin obtained “from-plate” using a-cyano-4-hydroxycinnamic acid as matrix.

Handbook of Advanced Chromatography / Mass Spectrometry Techniques - Chapter 5 Figure 14

Figure 5.14

Matrix assisted laser desorption/ionization spectra of nonlabeled cytochrome c (1), lysozyme (2), and myoglobin (3) separated on 50-mm-thick poly(butyl acrylate-co ethylene dimethacrylate) monolithic layer attached to a glass plate using 0.1 vol% trifluoroacetic acid in 60 vol% aqueous acetonitrile as the mobile phase obtained “from plate” using sinapic acid as matrix.

Handbook of Advanced Chromatography / Mass Spectrometry Techniques - Chapter 5 Figure 15

Figure 5.15

Thin-layer chromatography separation of a mixture of proteins ribonuclease A, lysozyme, myoglobin, and myoglobin dimer labeled with fluorescamine using 50 mm-thick poly(4-methylstyrene- co-chloromethylstyrene-co- divinylbenzene) monolithic layer developed by 65% acetonitrile in 0.1% aqueous trifluoroacetic acid solution and matrix-assisted laser desorption/ionization time-of flight mass spectrometry spectra obtained from the spots using sinapic acid matrix.

Handbook of Advanced Chromatography / Mass Spectrometry Techniques - Chapter 5 Figure 16

Figure 5.16

Optical microscopic image of cross section of the superhydrophilic channel filled with aqueous solution of red dye (A) and schematic illustration of desorption electrospray ionization scanning of surface of poly(butyl acrylate coethylene dimethacrylate) monolithic layer to visualize the 2D separation (B).

Handbook of Advanced Chromatography / Mass Spectrometry Techniques - Chapter 5 Figure 17

Figure 5.17

Two-dimensional Thin-layer chromatography separation of a mixture of labeled peptides including leucine
enkephalin, bradykinin, angiotensin II, and val-tyr-val on monolithic polymer layer with dual chemistry detected using UV detection.

Handbook of Advanced Chromatography / Mass Spectrometry Techniques - Chapter 5 Figure 18

Figure 5.18

Desorption electrospray ionization (DESI) mass spectrometry (MS) scan of the first dimension separation of peptides leucine enkephalin, bradykinin, angiotensin II, and val-tyr-val achieved in the 30 mm long virtual channel grafted with the 2-acrylamido-2-methyl-1 propanesulfonic acid-2-hydroxyethyl methacrylate mixture (top spectrum) and DESI-MS spectra of individual peptides.

Handbook of Advanced Chromatography / Mass Spectrometry Techniques - Chapter 5 Figure 19

Figure 5.19

Desorption electrospray ionization (DESI) mass spectrometry (MS) spectra of leucine enkephalin, bradykinin, angiotensin II, and val-tyr-val observed during scan of the entire plate after two dimensional separation using monolithic polymer layer with dual chemistry.

Handbook of Advanced Chromatography / Mass Spectrometry Techniques - Chapter 5 Figure 20

Figure 5.20

Artistic rendition of the gradient of hydrophobicity at a monolithic thin-layer chromatography plate increasing in the direction of the arrow together with suggested directions of the separations in first (1st D) and second dimension (2nd D) (A), and visualization of the gradient of hydrophobicity using fluorescent labeling with 1- anilinonaphthalene-8-sulfonic acid (B). The bright area at the left down corner represents the most hydrophilic part and the dark at top right most hydrophobic part.

Handbook of Advanced Chromatography / Mass Spectrometry Techniques - Chapter 5 Figure 21

Figure 5.21

Separation of leucine enkephalin, gly-tyr, val-tyr-val, and oxytocin on plates consisting of poly(glycidyl methacrylate -ethylene dimethacrylate) monolith (A), poly(glycidyl methacrylate-ethylene dimethacrylate) monolith with hydrolyzed epoxy groups (B), monolithic layer with poly(lauryl methacrylate) homogeneously photografted on the entire surface (C), and monolithic layer with hydrophilized surface photografted with a diagonal gradient of poly(lauryl methacrylate) (D) using mobile phase 0.1% trifluoroacetic acid in 30% acetonitrile-water in the first dimension and 0.1% trifluoroacetic acid in 50% methanol-water in the second dimension.

Handbook of Advanced Chromatography / Mass Spectrometry Techniques - Chapter 5 Figure 22

Figure 5.22

Matrix assisted laser desorption/ ionization-mass spectrometry spectra of leucine enkephalin and oxytocin obtained after ionization from the plate after separation in first (left panels) and second dimension (right panels) a-cyano-4-hydroxycinnamic acid as matrix.

Overview of the Contents:

The Handbook of Advanced Chromatography /Mass Spectrometry Techniques is a compendium of new and advanced analytical techniques that have been developed in recent years for analysis of all types of molecules in a variety of complex matrices, from foods to fuel to pharmaceuticals and more. Focusing on areas that are becoming widely used or growing rapidly, this is a comprehensive volume that describes both theoretical and practical aspects of advanced methods for analysis. Written by authors who have published the foundational works in the field, the chapters have an emphasis on lipids, but reach a broader audience by including advanced analytical techniques applied to a variety of fields.


Handbook of Advanced Chromatography / Mass Spectrometry Techniques

Key Features

Contains both practical and theoretical knowledge, providing core understanding for implementing modern chromatographic and mass spectrometric techniques Presents chapters on the most popular and fastest-growing new techniques being implemented in diverse areas of research.


Handbook of Advanced Chromatography / Mass Spectrometry Techniques

Table of Contents

The Chapters are listed above. Additional links to the fully enumerated Table of Contents will be added soon.

Complete Table of Contents »

Handbook of Advanced Chromatography / Mass Spectrometry Techniques

Expected Readership

The Handbook is intended for upper level undergraduate students and graduate students, researchers, technicians, and scientists.It is also well suited for advanced analytical instrumentation students as well as for analysts seeking additional knowledge or a deeper understanding of familiar techniques.


Handbook of Advanced Chromatography / Mass Spectrometry Techniques

Book Details

No. of pages: 520
Copyright: © Academic Press and AOCS Press 2017
Published: September 11th 2017
eBook ISBN: 9780128117330
Paperback ISBN: 9780128117323