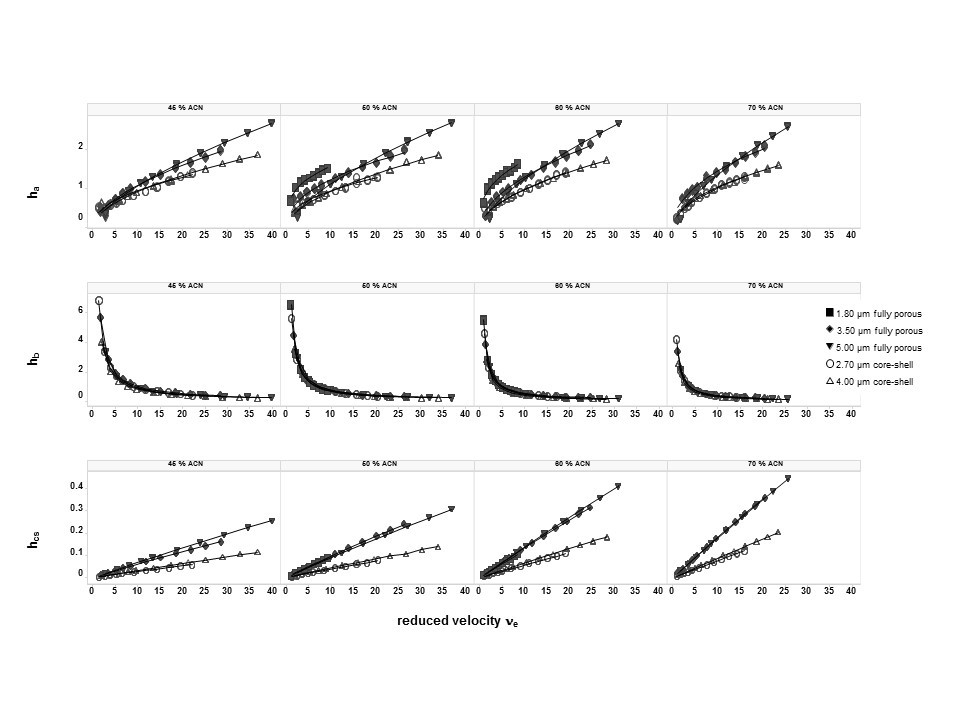
Figure 6-5. Plots of the individual contributions to the reduced plate height curves in different mobile phases. Upper panel ha, medium panel hb, and lower panel hcs.*Click on image for full-size .jpg*<< Back to Chapter 6 <<