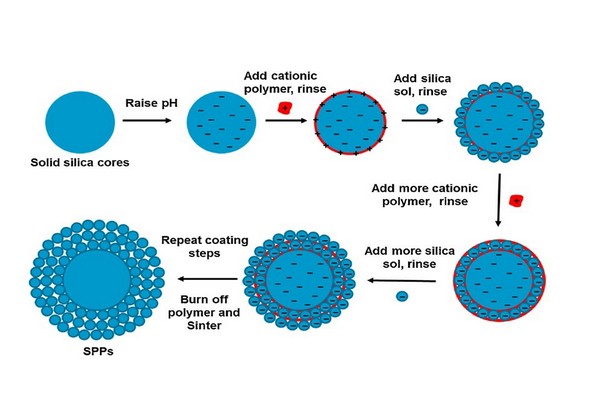
Figure 6.1
Schematic representation of layer-by-layer process for synthesis of coreeshell particles.
Reprinted with permission from Chen, W., Jiang, K., Mack, A., Sachok, B., Zhu, X., Barber, W.E., Wang, X., 2015. Synthesis and optimization of wide pore superficially porous particles by a one-step coating process for separation of proteins and monoclonal antibodies. J. Chromatogr. A 1414, 147-157.
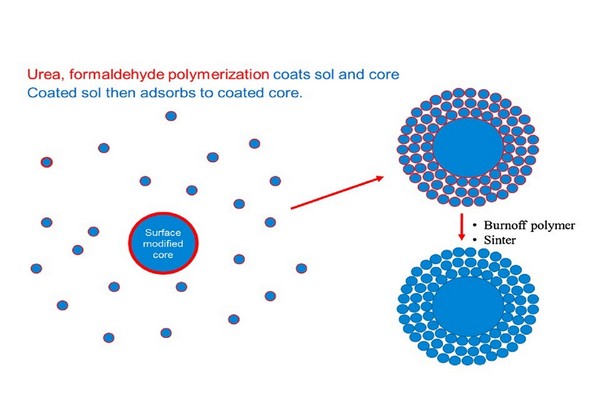
Figure 6.2
Schematic representation of coacervation method for synthesis of coreeshell particles.
Reprinted with permission from Chen, W., Jiang, K., Mack, A., Sachok, B., Zhu, X., Barber, W.E., Wang, X., 2015. Synthesis and optimization of wide pore superficially porous particles by a one-step coating process for separation of proteins and monoclonal antibodies. J. Chromatogr. A 1414, 147-157.
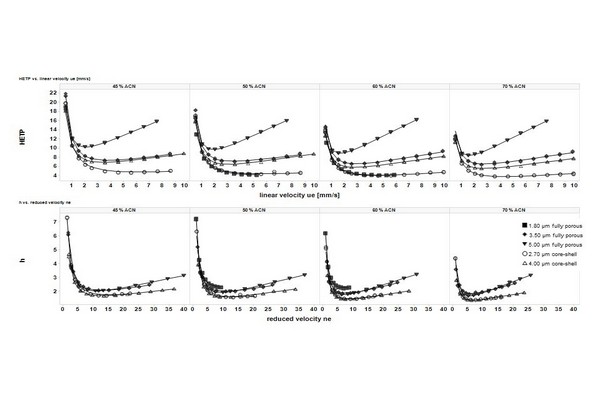
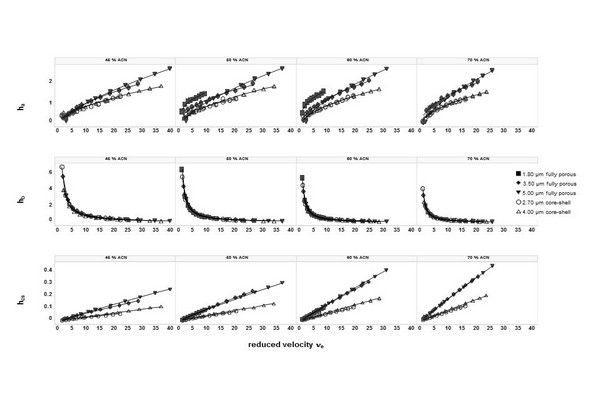
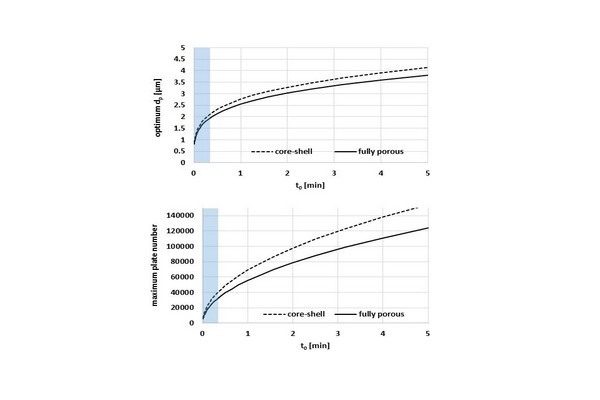
Figure 6.3
Curves of height equivalent of a theoretical plate versus interstitial velocity (upper panel) and h versus n (lower panel) for three columns packed with fully porous and two columns packed with coreeshell particles in different mobile phases. For column details, see Table 6.1.
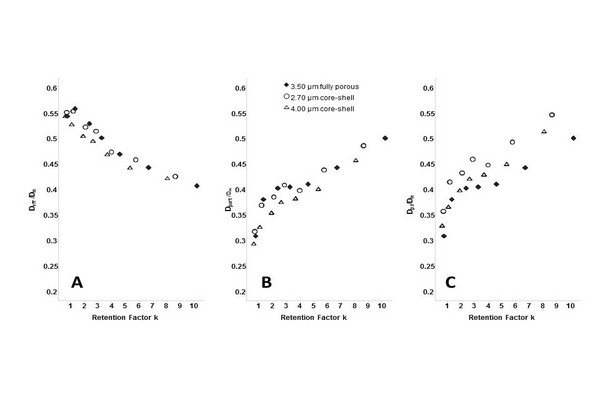
Figure 6.4
Plots of Deff/Dm (A), Dpart/Dm (B), and Dpz/Dm (C) versus retention factor for columns 2, 4, and 5 (Table 6.1).