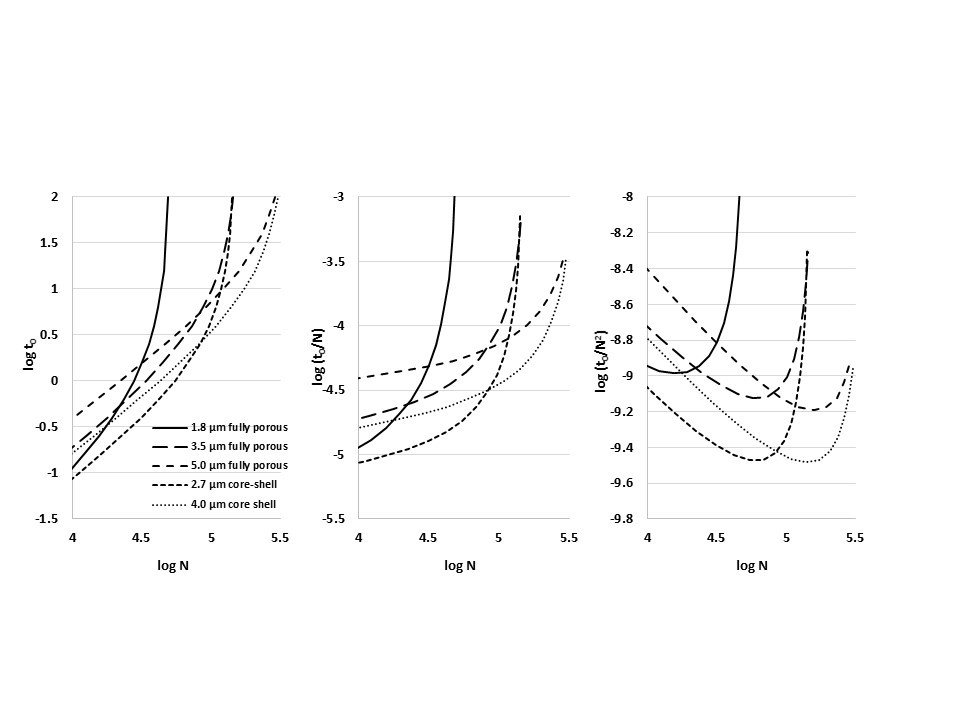
Figure 6-7. Different representations of experimental kinetic plots for the columns listed in Table 6.1 in 50% acetonitrile using the recommended pressure limits for each column. (A) log t0 versus log N, (B) log (t0/N) versus log N, and (C) log (t0/N2) versus log N.
*Click on image for full-size .jpg*
<< Back to Chapter 6 <<