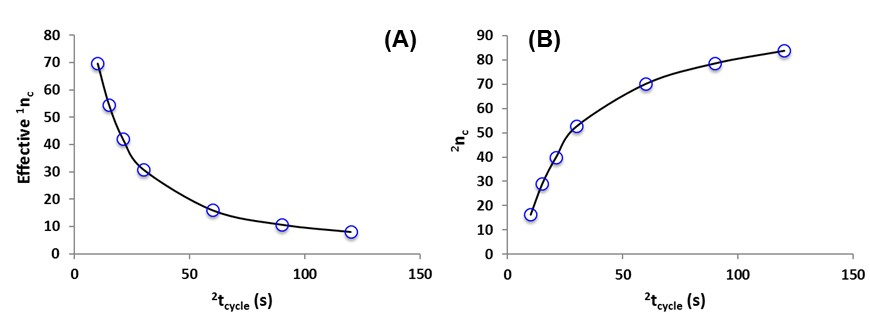
Figure 7-12. Illustration of the dependence of effective two dimensional (2D) peak capacity (nc,2D) on second dimension (2D) analysis time 2tcycle. Calculations were made as follows: the native first dimension (1D) analysis time and peak capacity (i.e., without undersampling) were assumed to be 30 and 100 min, respectively, and the effective 1D peak capacity (A) was calculated using Eq. (7.5); the dependence of 2D peak capacity (B) on 2D cycle time is the same as that reported previously (Davis and Stoll, 2014); finally, the effective 2D peak capacity (C) is calculated as the product of the effective 1D peak capacity and the 2D peak capacity at each value of 2tcycle.
Adapted from Bedani, F., Schoenmakers, P.J., Janssen, H-G., 2012. Theories to support method development in comprehensive two-dimensional liquid chromatography - a review. J. Sep. Sci. 35, 1697-1711. http://dx.doi.org/10.1002/jssc.201200070.
*Click on image for full-size .jpg*
<< Back to Chapter 7 <<