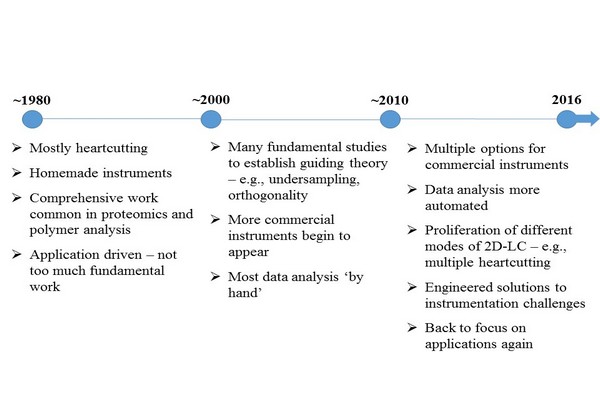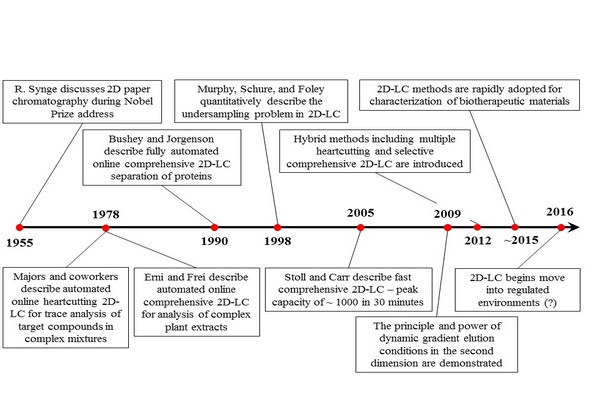
Figure 7.5
Some key milestones in the development of two-dimensional liquid chromatography (2D-LC). References for these events by year are: 1955 (Synge, 1952), 1978 (Apffel et al., 1981; Erni and Frei, 1978), 1990 (Bushey and Jorgenson, 1990), 1998 (Murphy et al., 1998), 2005 (Stoll and Carr, 2005), 2009 (Bedani et al., 2009; Jandera et al., 2010), 2012 (Groskreutz et al., 2012a; Zhang et al., 2013a), 2015 (Stoll et al., 2016), and 2016 (Largy et al., 2016).
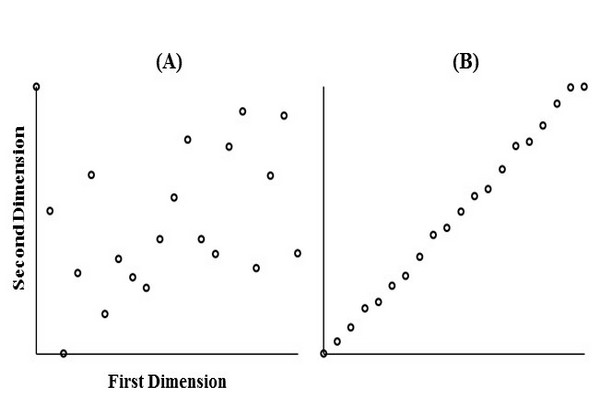
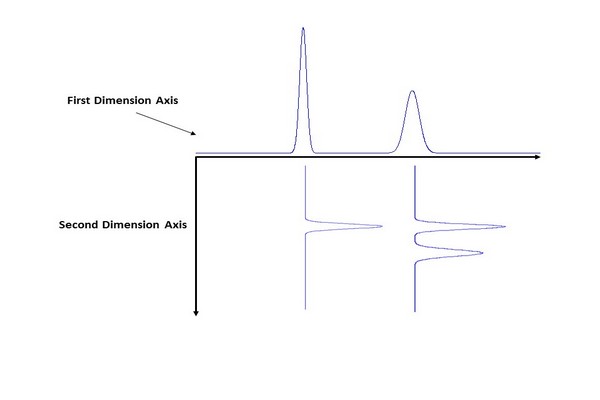
Figure 7.6
Illustration of the complementarity of retention mechanisms in 2D separations. (A) Example of peak pattern obtained with highly complementary 1D and 2D separations; (B) peak pattern obtained with separations that are not complementary; and (C) example of peak pattern obtained with separations that are somewhat complementary.
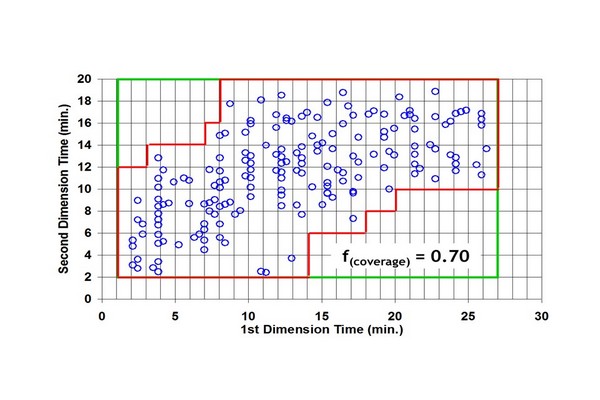
Figure 7.7
Illustration of a box-counting method, which counts the fraction of bins in a two-dimensional separation bed that is occupied by peaks. This fraction enables correction of the total peak capacity for incomplete usage of the separation space. Circles represent coordinates of observed peaks in an experimental LC x LC separation. The red (gray line in print versions) line defines the perimeter around the bins that are considered to be occupied. LC, liquid chromatography.
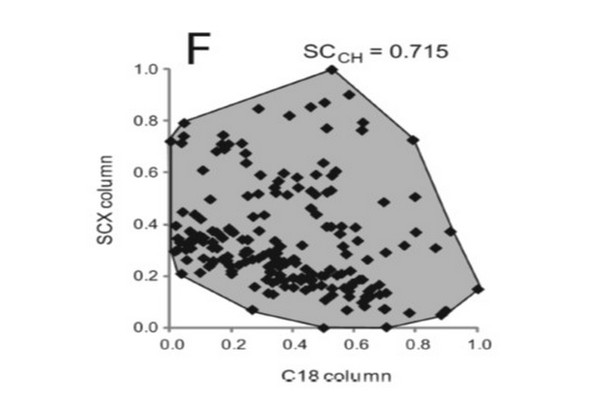
Figure 7.8
Illustration of the use of convex hulls to estimate the fraction of separation space occupied by peaks.
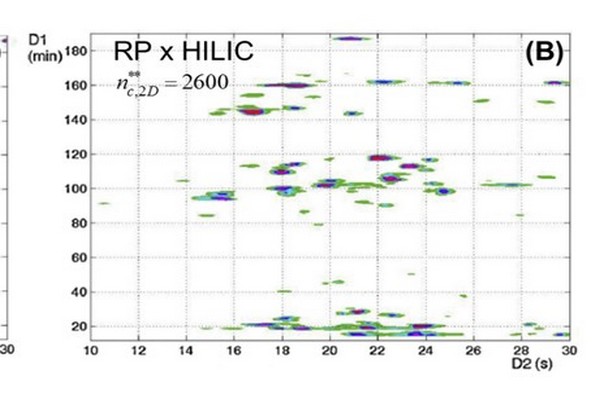
Figure 7.9
Comparison of LC x LC separations of peptides using RP-LC in the first dimension and either RP-LC (A) or HILIC (B) separation in the second dimension. In spite of the higher fractional coverage in the RP x HILIC case, the effective 2D peak capacity is lower because of the low peak capacity of the HILIC 2D separation. HILIC, hydrophilic interaction liquid chromatography; LC, liquid chromatography; RP, reversed-phase.
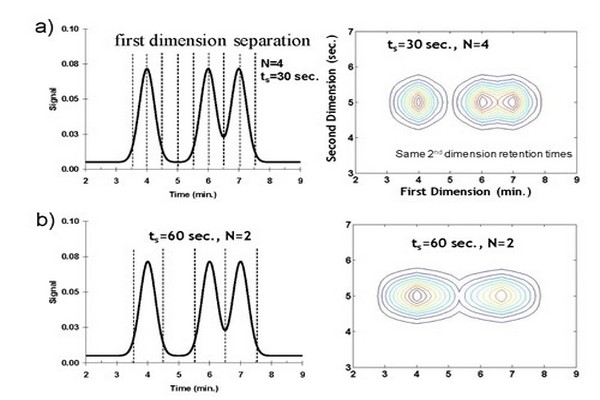
Figure 7.10
Effect of sampling time (rate) on resulting LC x LC contour plot. Panel (A) sampling at the Murphy- Schure-Foley recommendation of ts = 2 1sigma; N = 4 samples/8 1sigma. As the sampling time is increased there is more remixing of 1D peaks, and resolution in the two dimensional chromatogram is lost; panel (B) sampling at N = 2; and panel (C) sampling at N = 1.
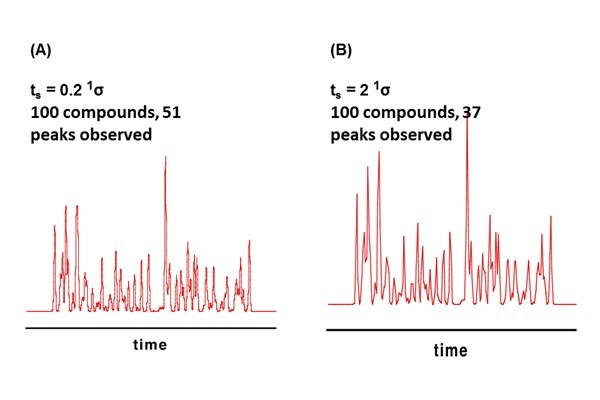
Figure 7.11
Effect of undersampling on effective one-dimensional (1D) peak capacity. Reconstructed 1D chromatograms for a hypothetical sample containing 100 randomly spaced compounds show that sampling at a rate of 5 samples per 1sigma (ts = 0.2 1sigma) yields a separation with 51 peaks. Increasing the sampling time to 2 1sigma (Panel B) or 4 1sigma (Panel C) yields 37 or 23 peaks, respectively.
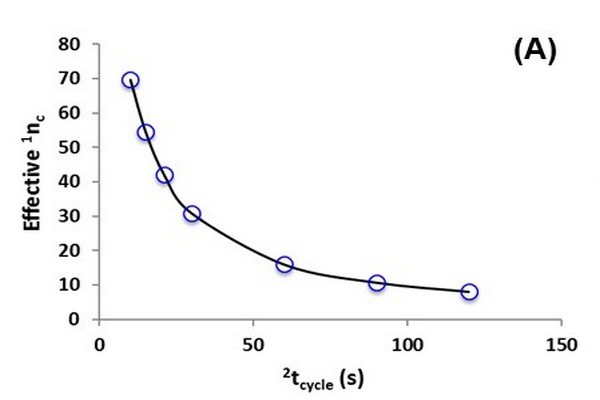
Figure 7.12
Illustration of the dependence of effective two dimensional (2D) peak capacity (nc,2D) on second dimension (2D) analysis time 2tcycle. Calculations were made as follows: the native first dimension (1D) analysis time and peak capacity (i.e., without undersampling) were assumed to be 30 and 100 min, respectively, and the effective 1D peak capacity (A) was calculated using Eq. (7.5); the dependence of 2D peak capacity (B) on 2D cycle time is the same as that reported previously (Davis and Stoll, 2014); finally, the effective 2D peak capacity (C) is calculated as the product of the effective 1D peak capacity and the 2D peak capacity at each value of 2tcycle.
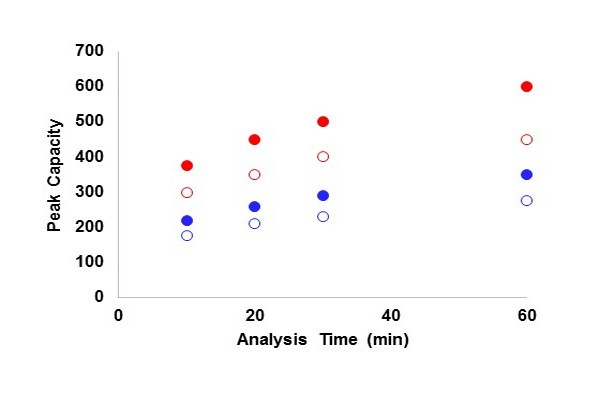
Figure 7.13
Peak capacity as a function of analysis time for one dimensional liquid chromatography with different pressure limitations and for different analyte types. Blue (dark gray in print versions) circles are for small nonpeptide molecules with d(ln k)/d(Phi) = 8, and red (light gray in print versions) circles are for peptide molecules with d(ln k)/d(Phi) = 25. Open circles are for a pressure limit of 400 bar, and filled circles are for 1000 bar. Plate numbers are first estimated for dead times that are 10% of the analysis time assuming three-parameter optimization at 40oC (Carr et al., 2009), and then gradient peak capacity is calculated from these plate numbers using the approach prescribed by Neue (2005).
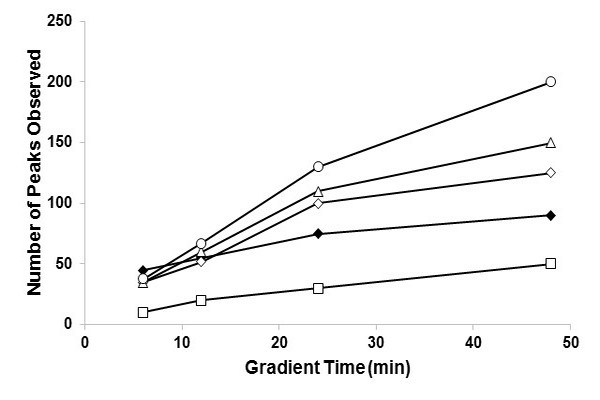
Figure 7.14
Numbers of peaks observed in separations of plant extracts. For LC x LC separations, the 2D cycle time was varied to demonstrate the optimum cycle time- 2D cycle times are: 40 (open diamonds), 21, (open circles), 12 (open triangles), and 6 (open squares) sec. At analysis times of about 10 min, the two-dimensional liquid chromatography method outperforms the one dimensional liquid chromatography method (filled diamonds) and remains superior at all longer times.
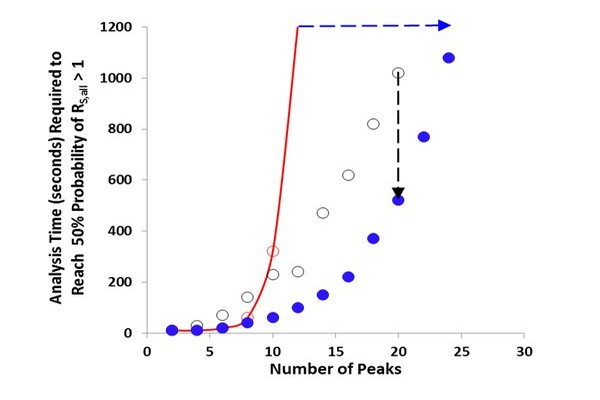
Figure 7.15
Time required to reach 50% probability of resolving all of the components in a mixture for different liquid chromatography (LC) techniques: one-dimensional liquid chromatography [ (light gray in print versions)], LC x LC (B), sLC x LC [ (dark gray in print versions)]. The red (gray in print versions) line is an interpolation between the times for 10 and 12 sample components. sLC x LC, selective comprehensive two-dimensional liquid chromatography.
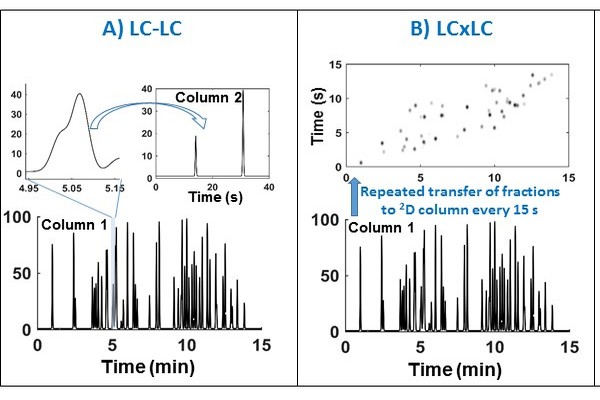
Figure 7.16
Conceptual comparison of LCxLC, LC x LC, and sLC x LC modes of two-dimensional liquid chromatography (2D-LC) separation. Panel A shows the case of LC-LC (heartcutting 2D-LC) where, in this case, only a single fraction is injected into the 2D column. Note that in multiple heartcutting (mLC-LC, not shown) more than one region of the first dimension (1D) effluent would be injected onto the second dimension (2D) column. Panel B shows the case of LC x LC (comprehensive 2D-LC) where the entire 1D effluent is sequentially injected. Panel C shows the case of sLC x LC (selective comprehensive 2D-LC) where selected segments of the 1D effluent are injected comprehensively on to the 2D column.
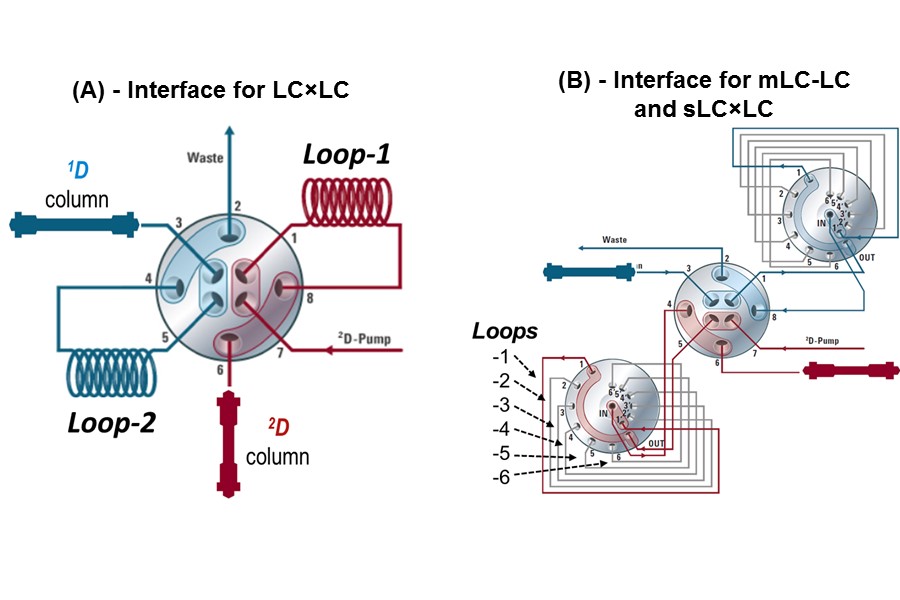
Figure 7.17
Example valve interfaces used for mLC-LC, sLC x LC, and LC x LC separations. Either configuration can also be used for simple single heartcut operation (LC-LC). 1D, first dimension; 2D, second dimension; LC, liquid chromatography.
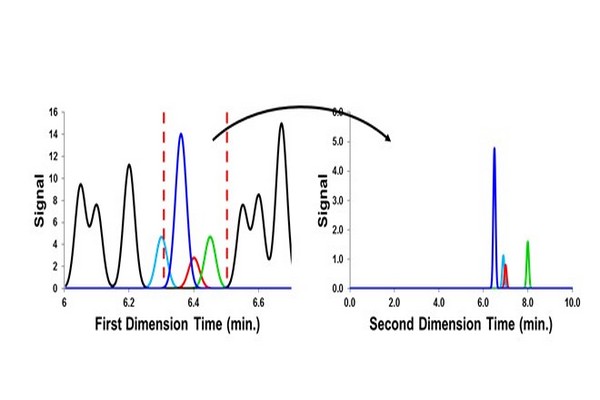
Figure 7.18
Consequence of using a large sampling window [indicated by the red (dark gray in print versions) dashed vertical lines] in the case of single heartcut operation of two dimensional liquid chromatography. Sample components that had been separated from the target compound (red peak (dark gray in print versions)) by the 1D column are remixed and some are not reseparated (the teal peak (gray in print versions) here) from the target analyte by the 2D column.
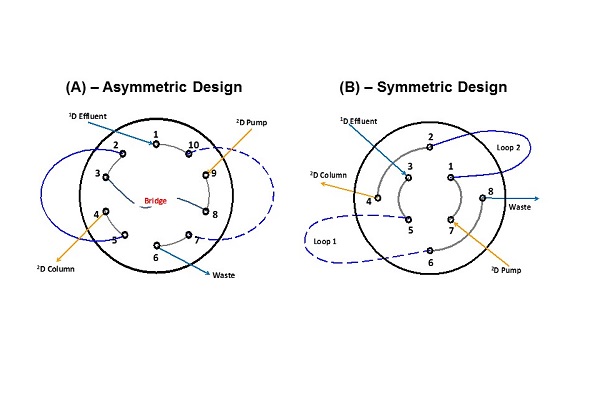
Figure 7.19
Flow paths through two different valve designs in common use. The valve shown in Panel A has an asymmetric design, whereas the valve shown in Panel B has a symmetric design. 1D, first dimension; 2D, second dimension.
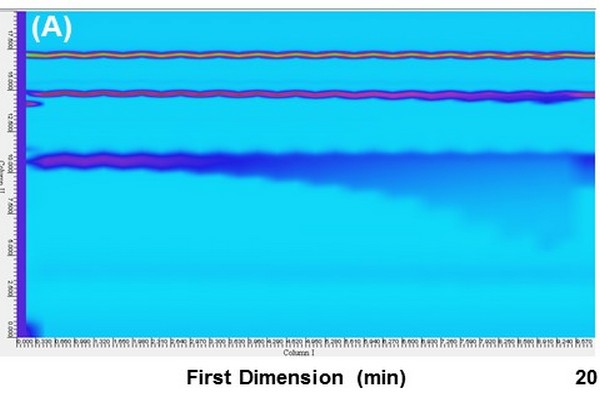
Figure 7.20
Pseudo two-dimensional liquid chromatography (2D-LC) chromatograms obtained from two nominally identical 2D-LC systems differing only in the type of valve used in the interface. A three-component analyte mixture was infused directly into the valve, resulting in repeated injection of the sample every 20 s throughout the analysis. The result in Panel A involved an asymmetric interface valve, whereas the result in Panel B involved a symmetricvalve.
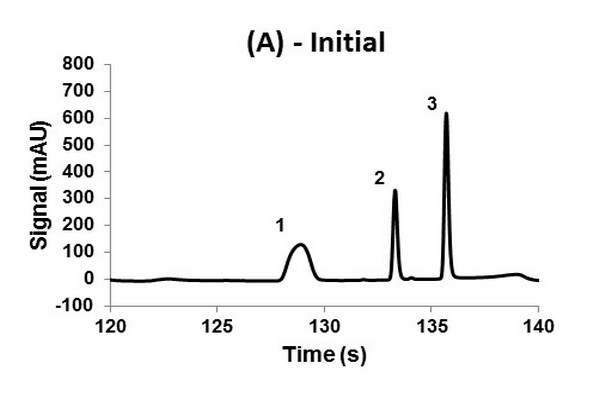
Figure 7.21
Second dimension (2D) chromatograms showing the change in peak shape observed for the 2D column after 2 h of continuous LC x LC operation (360 cycles) using an electrically actuated 10-port/2-position valve in the interface. The sample injection occurred at 120 s relative to the start of the LC x LC separation (2.0-2.33 min). Panel A shows the initial performance of the column during the very first LC x LC separation, and Panel B shows the performance of the same column after 2 h of use. The probe compounds are (1) nitropropane, (2) nitropentane, and (3) dipropyl phthalate.
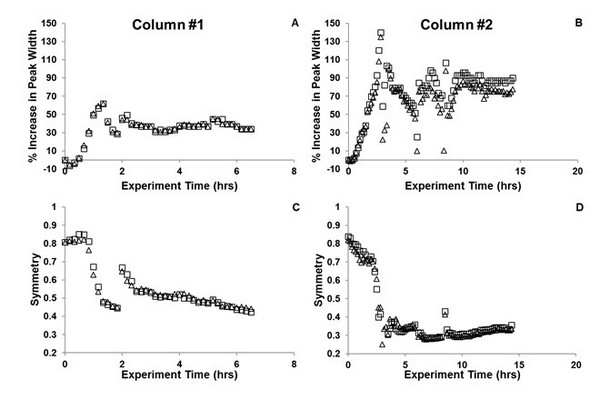
Figure 7.22
Changes in peak width (A, B) and symmetry (C, D) for the probe compound nitropentane using two nominally identical columns prepared with sub-three micron superficially porous particles and C18 bonded phase, and the 10-port/2-position valve design shown in Fig. 7.19A. Evidence of column failure appears after just an hour of two-dimensional liquid chromatography operation.
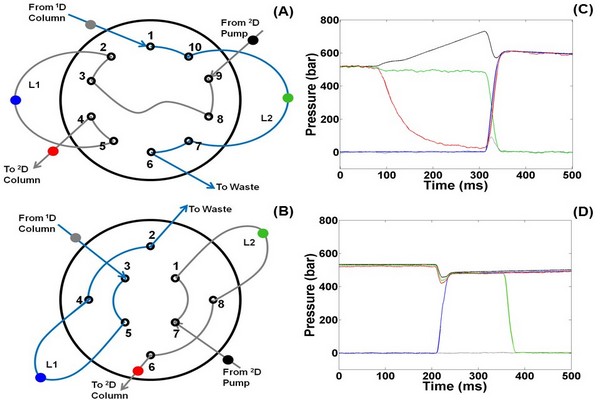
Figure 7.23
Locations of pressure sensors and resulting pressure traces recorded during the switch from Position 1 to Position 2 of these valves. The traces in (C) are for the valve shown in Panel A, and the traces in (D) are for the valve shown in Panel B. The colors of the traces correspond to the locations of the sensors indicated with the same colors. 1D, first dimension; 2D, second dimension.
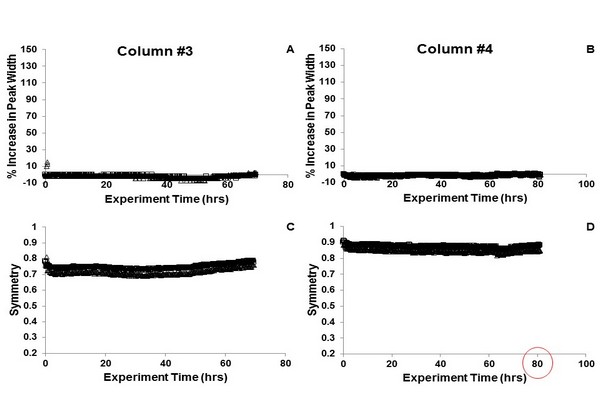
Figure 7.24
Changes in peak width (A, B) and symmetry (C, D) for the probe compound nitropentane using two nominally identical columns prepared with sub-three micron superficially porous particles and C18 bonded phase, and the 8-port/2-position valve design shown in Fig. 7.19B. The columns are stable under continuous operation for at least several days.
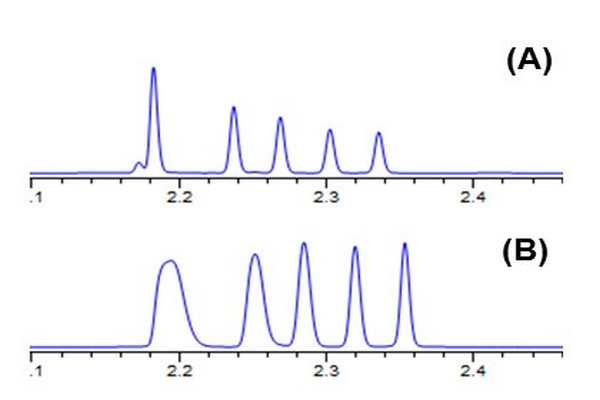
Figure 7.25
Effect of the volume and composition of fractions collected from the one-dimensional column and injected into the second dimension (2D) column on performance of the 2D separation. Conditions: 30 mm x 2.1 mm i.d. Zorbax SB-C18 column; 40oC; 2.5 mL/min; gradient elution from 50% to 90% ACN over 15 s; solutes are alkylphenone homologs. Chromatograms were obtained with: (A) 2 mL injection of sample in 50/50 ACN/water; (B) 40 mL injection of sample in 50/50 ACN/water; (C) 40 mL injection of sample in 70/30 ACN/water; and (D) 40 mL injection of sample in 30/70 ACN/water. 2D, second dimension.
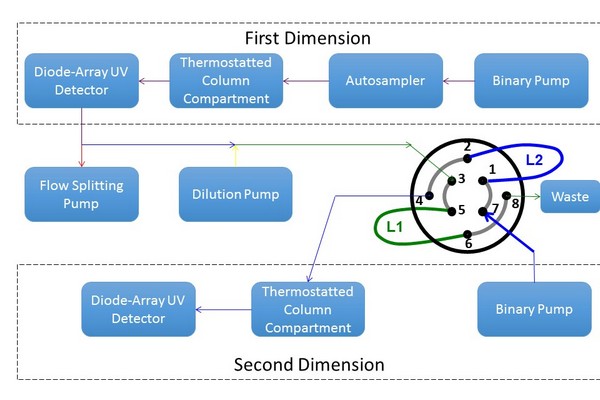
Figure 7.26
Instrument configuration used to study the effect of one dimensional effluent fraction composition and volume on two-dimeensional resolution and detection sensitivity.
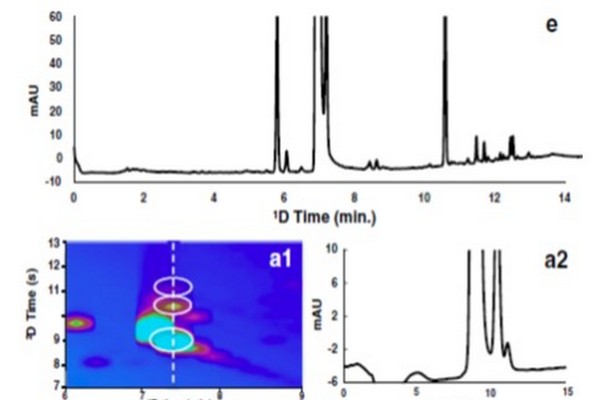
Figure 7.27
Effect of interface conditions on the ability to both resolve and detect trace-level degradants coeluting with the main peak (naproxen) in the first dimension of a high quality LC x LC separation of photodegraded naproxen. The one-dimensional (1D) separation is shown in Panel E. Panels A1-D1 are subsections of LC x LC separations focused on the region where naproxen and neighboring peaks elute. Panels A2-D2 show the two-dimensional chromatograms observed at the position indicated by the white dashed vertical line in Panel A1.
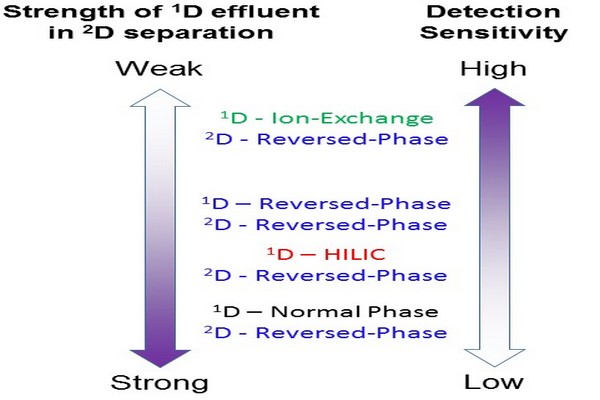
Figure 7.28
Effect of the solvent strength of the 1D effluent in the 2D separation mode on detection sensitivity at the outlet of the 2D column. HILIC, hydrophilic interaction liquid chromatography.
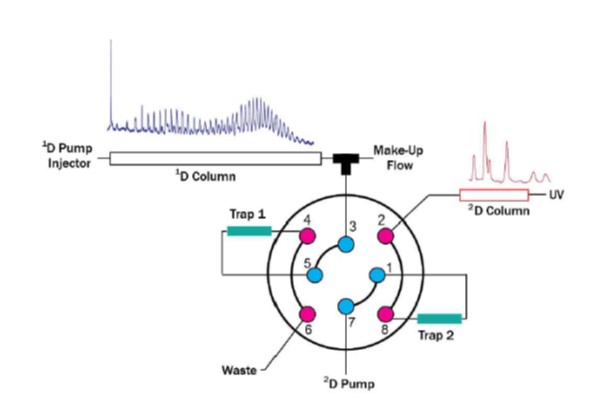
Figure 7.29
Illustration of a system for two-dimensional liquid chromatography capable of both online dilution between dimensions and the use of packed traps instead of open sample loops in the valve interface. 1D, first dimension; 2D, second dimension.
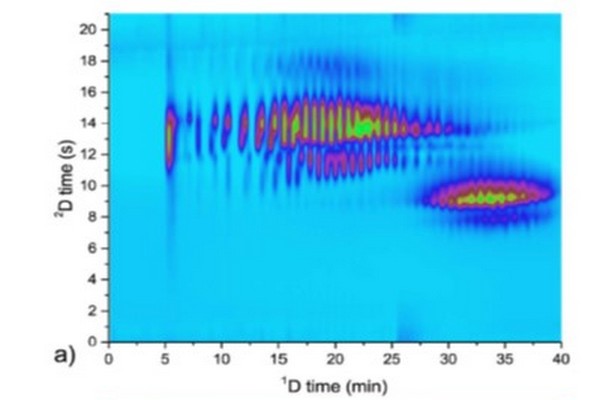
Figure 7.30
Comparison of chromatograms obtained from LC x LC separations of tristyrylphenol ethoxylate phosphate surfactants using an interface equipped with open loops (A) or packed traps (B). 1D, first dimension; 2D, second dimension.
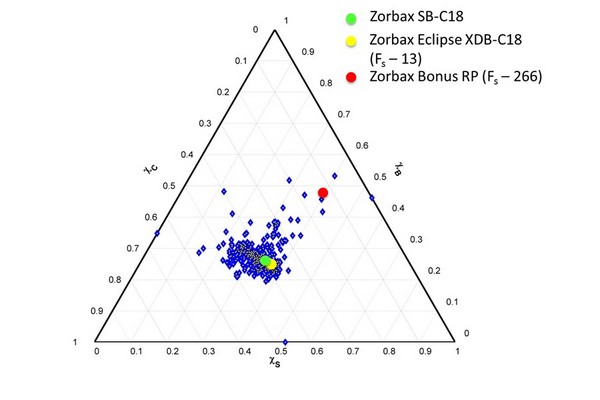
Figure 7.31
Selectivity classification of 632 reversed-phase columns using the S-B-C triangle with weighting factors inversely related to the range of each parameter (e.g., S/H), and normalized to the range of S*. The coordinates of three specific phases are highlighted, along with the calculated Fs values for two of the phases in comparison to Zorbax SB-C18.
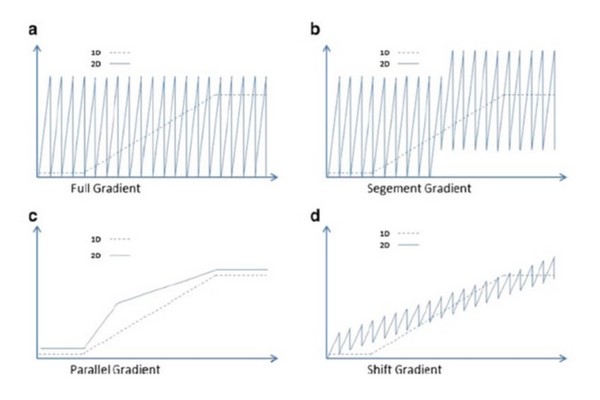
Figure 7.32
Examples of dynamic elution profiles that can be used in the second dimension of two-dimensional liquid chromatography systems. In each plot the dashed trace represents the eluent composition used in the first dimension, and the solid trace represents the eluent composition used in the second dimension.
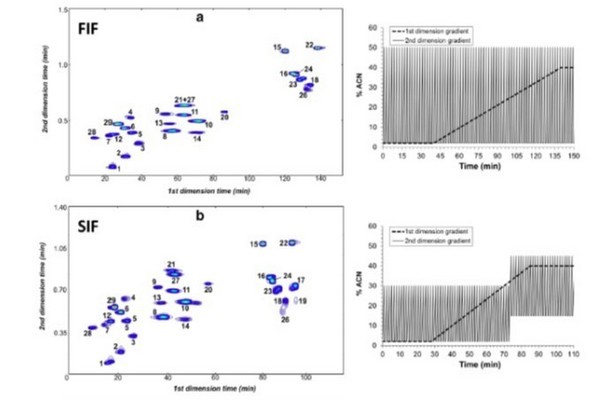
Figure 7.33
Examples of the effect of 2D elution conditions on the utilization of the 2D separation space in LC x LC separations of phenolic acids and flavones. The separation in Panel (A) is obtained when the same 2D gradient is used throughout the 2D separation. The separation in Panel (B) is obtained when the 2D separation is split into two segments, and different gradient elution programs are used in each segment. Finally, Panel (C) shows that the peaks can be further spread out by using isocratic conditions in the second dimension that are optimized over the course of the 2D analysis time to maximize use of the available separation space.
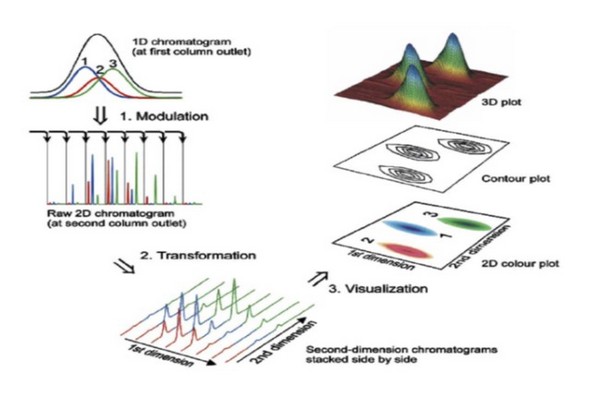
Figure 7.34
Illustration of the flow of information in a two-dimensional liquid chromatographyexperiment. The scenario shown here is precisely applicable to LC x LC, but can be extended to other implementations of 2D separation. (1) Peaks eluting from the 1D column are sampled multiple times, which leads to the appearance of a particular compound in multiple 2D chromatograms. (2) The data from these 2D separations are then transformed into a 2D array of data where the two dimensions are 1D and 2D time. This array can then be visualized as a contour plot or a 2D topographic map, both of which can be colored in various ways to aid visualization.