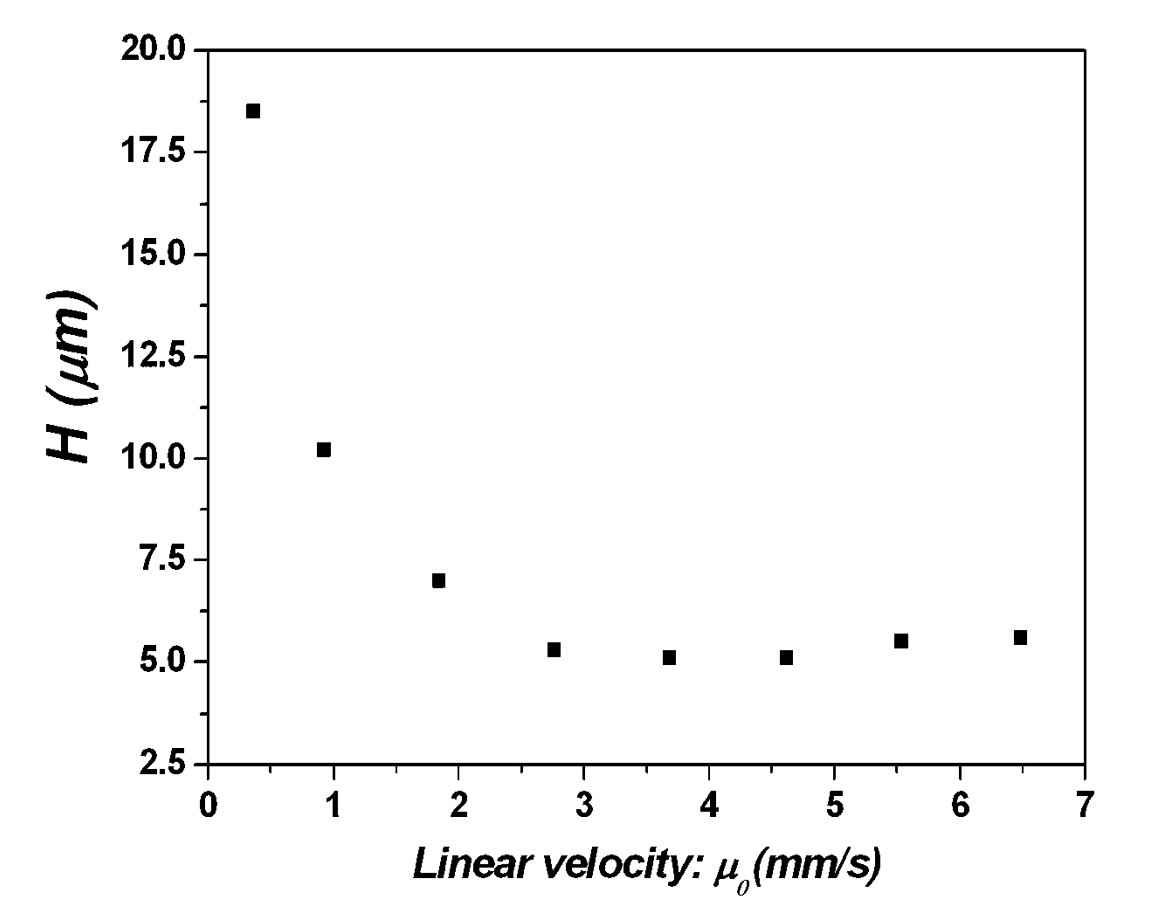
Figure 3-9. Representation of the van Deemter plot of the column packed with 1.9 um DACH DNB CSP.*Click on image for full-size .jpg*<< Back to Chapter 3 <<